
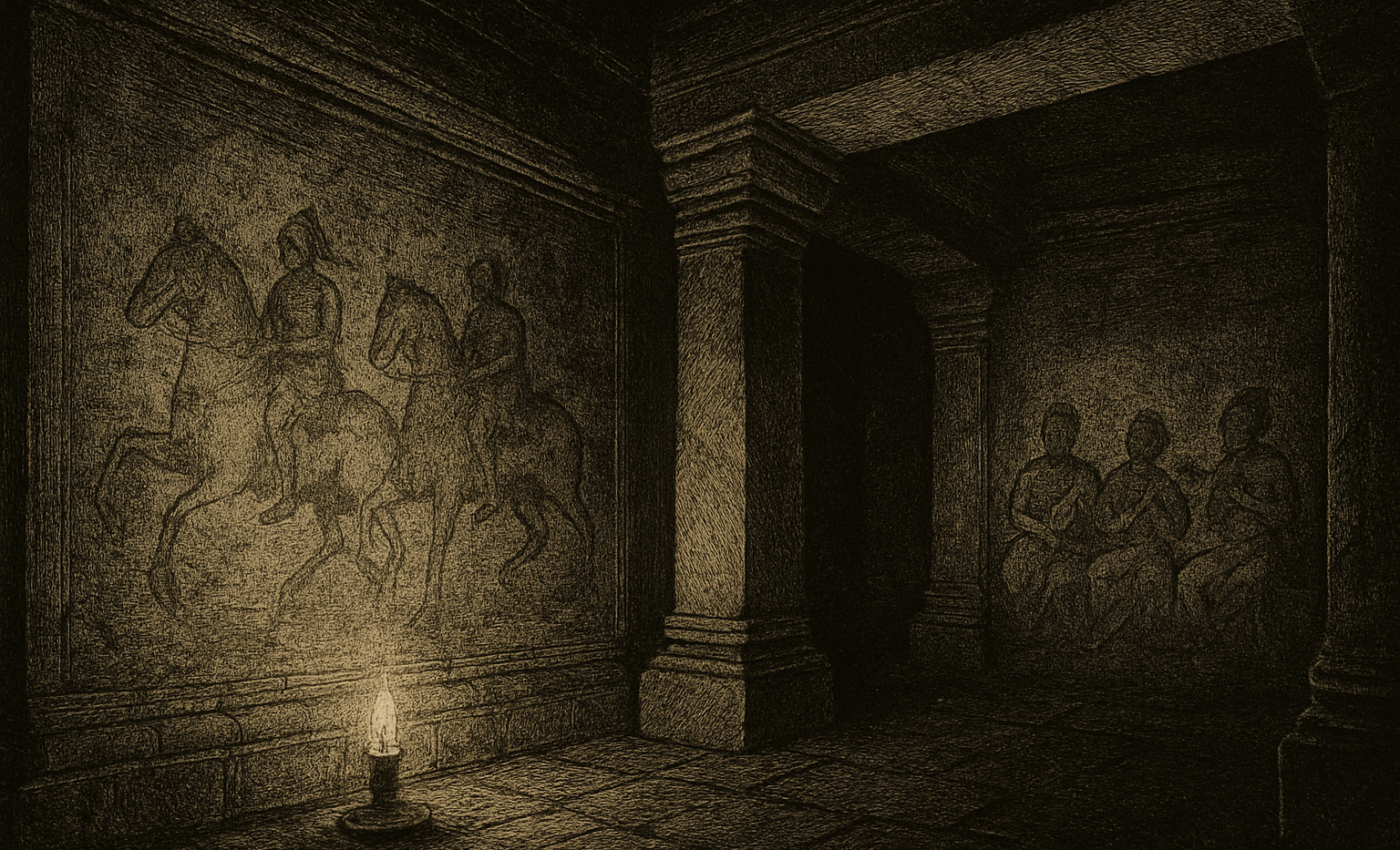
On the walls of a chamber near the top of the central tower in the ancient Cambodian temple Angkor Wat, paintings depict horseback riders and a traditional musical ensemble. Every day, thousands of visitors pass these images without noticing, because they’re faded to the point of invisibility.
They were discovered, along with about 200 other paintings throughout the sprawling complex, between 2010 and 2012 by a Singaporean archaeologist using a method conceived at NASA’s Jet Propulsion Laboratory in Southern California.
The Method Behind the Find
The technique, known as decorrelation stretch, heightens contrasts in digital imagery, making subtle differences clearer and features easier to spot. Originally used by NASA to extract more information from satellite imagery, it has proven useful in many fields but has come to be especially widely used for studying ancient rock art. This is partly because these images are commonly faded beyond recognition. But it’s also due to the chance intersection of one man’s hobby with his unrelated professional and educational background.
How One Archaeologist Found the Paintings
In the 1980s, one of Jon Harman’s friends brought him along on a few field trips with a local rock art group, and the mystery surrounding these ancient images intrigued him. “No one really knows why people made the rock art they made, at least in many cases,” he said. “And the symbols are quite strange.”
At a rock art conference around 2005, someone showed him images from NASA’s Mars Exploration Rover webpage, depicting the Martian surface with and without the application of decorrelation stretch. Seeing how much detail the technique revealed, he understood the implication for studying ancient, faded images.
He also happened to work in medical imaging. “I Googled it and found a NASA paper that explained how to do the algorithm,” he said. “I knew from my medical imaging experience that I could do it, so I did.”
Thus was born the Dstretch plug-in and, later, Dstretch apps for Android and iOS.
What Decorrelation Stretch Actually Does
Rather than simply raising the contrast between colors, decorrelation stretch maps the original colors to a different, expanded range of colors. It’s a complicated process that includes steps like diagonalizing color matrices. “Diagonalizing is algebra, and I have a PhD in math from Berkeley, where I studied algebra,” said Harman, now retired in Pacifica, California.
The technique is based on the Karhunen–Loève Transform, a theorem used in statistical analysis and coinvented by Michel Loève, one of Harman’s former math professors.
The Dstretch plug-in is for use with ImageJ, an open-source image processing and analysis program originally developed by the National Institutes of Health.
From Statistics to Geology
The paper Harman found detailing the process was written in 1996 by Ronald Alley, a JPL employee who at the time was part of an international team developing scientific requirements for the upcoming Advanced Spaceborne Thermal Emission and Reflection Radiometer (ASTER). That imager, built by Japan, was launched in 1999 on the Terra satellite, where it still operates today alongside its more famous counterpart, the Moderate Resolution Imaging Spectroradiometer, or MODIS.
In the 1990s, Alley was working with a group of geologists at JPL, finding applications for satellite data. But he had previously worked in a digital image-processing group, and his supervisor there, Jim Soha, had cowritten a 1978 paper along with another JPL employee that proposed applying the Karhunen–Loève Transform to digital imagery for color enhancement. It was this technique that came to be called decorrelation stretch.
By the time scientists were making plans for ASTER, Alley and his geologist colleagues had been using decorrelation stretch to map lava flows on the big island of Hawaii for some time.
The original technique involved creating multiple intermediate images, each of which introduced slight inaccuracies through rounding. By replacing that process with one called matrix multiplication, Alley made decorrelation stretch both faster and more accurate.
He knew it would be useful for a multispectral imager like ASTER, which collects data in the visible spectrum and different infrared ranges, so he wrote the paper. “Someone had to write up a description of this thing so users would know what we were talking about,” he said.
Michael Abrams, the current ASTER science team leader, said his group still uses decorrelation stretch on infrared imagery to track plumes from volcanic eruptions, whose sulfur dioxide, ash, and water vapor have distinct infrared absorption bands.
The Spread of Dstretch
Harman first applied his Dstretch plug-in to photos he had taken of rock art in Baja California, Mexico. In one image featuring several human figures, a new yellow figure seemed to materialize from nowhere when the algorithm was applied. “That convinced me of the usefulness,” he said. “Then I started playing around and found that by changing the color space I was working in, I could get good results in different images.”
A color space is a range of numerically represented colors, such as the red-green-blue, or RGB, color space common among screen devices. Dstretch includes custom color spaces that have proven useful with Harman’s extensive image collection. In this way, Dstretch is tailored to rock art, but it can be and is used in many other contexts.
Harman said he gets about 200 requests per year from all over the world, which he fulfills for $50 apiece. Around 2010, he created smartphone apps that use a shortcut to mimic decorrelation stretch. “To do the actual Dstretch on a phone would be difficult and take forever,” he said.
Key Dates and Figures
| Date | Event |
|---|---|
| 1978 | Jim Soha and another JPL employee propose applying the Karhunen–Loève Transform to digital imagery for color enhancement |
| 1996 | Ronald Alley writes the paper detailing decorrelation stretch |
| 1999 | ASTER launches on the Terra satellite |
| 2005 | Harman sees NASA’s Mars Exploration Rover images at a rock art conference |
| 2010–2012 | Singaporean archaeologist discovers about 200 paintings at Angkor Wat using decorrelation stretch |
| Around 2010 | Harman creates Dstretch apps for Android and iOS |
The Numbers Behind Dstretch
- Harman receives about 200 requests per year, charging $50 each
- The apps use a shortcut to mimic decorrelation stretch
- The 1978 paper was co-written by Jim Soha and another JPL employee
- ASTER launched in 1999 on the Terra satellite
What This Means for Rock Art
Decorrelation stretch has become a standard tool for researchers working with faded or barely visible images. Its success stems from a combination of technical power and personal curiosity.
Alley’s original work was driven by practical problems in geology and remote sensing. Harman’s work was driven by a lifelong fascination with rock art. The two paths met in a shared interest in image processing, and the result is a technique that lets anyone see what the naked eye cannot.
The paintings at Angkor Wat remain hidden to most visitors. But thanks to a method born in NASA’s laboratories, they are no longer invisible to those who know where to look.
Source: spinoff.nasa.gov